Variable Rate Fertility
VARIABLE RATE FERTILITY
Background
Throughout the fertility and plant nutrition world the “4 R Nutrient Stewardship” is becoming commonplace. The 4 R’s refer to the right rate, right place, right time, and right source. As a producer this stewardship plan can help you adjust rates accordingly to soil changes within the field, providing a greater return on your fertility investment and maximizing your land’s potential.
How?
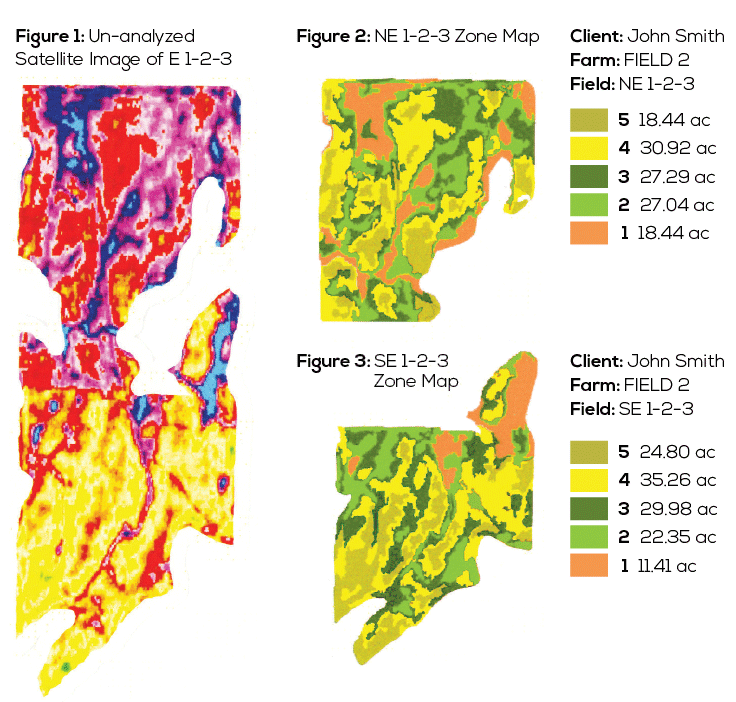
360° Ag Consulting uses geo-referenced field borders that exclude marginal areas of the field (example; sloughs). This allows us to use 5 m resolution satellite imagery to identify high and low producing areas of the field. We take this information and use it to further “ground truth” out in the field, see Figure 1. This figure is a infrared satellite image of a 240 acre wheat field taken In July 2012. As the color changes suggest, the production on the North ¼ of this field is a lot different than the South ¼ of the field. Past cropping history as well as elevation changes between the north and south quarters cause a distinct difference even though the field has been treated the same for several years. In order to fully appreciate the differences in this field we must split it and soil test it separately.
Soil Testing
At 360° Ag Consulting we believe that a variable rate fertility program is not compete without soil testing and “ground truthing” field zones by an experienced agronomist. For example, take the field shown In Figure 1. We have split the north and south examples into separate fields. The NE and SE of 1-2-3 is split into 5 zones, see Figures 2 and 3. Zone 1 has lower vegetation cover and Zone 5 has the highest vegetation cover. Within these zones a minimum of 8 cores are taken per zone.

Results
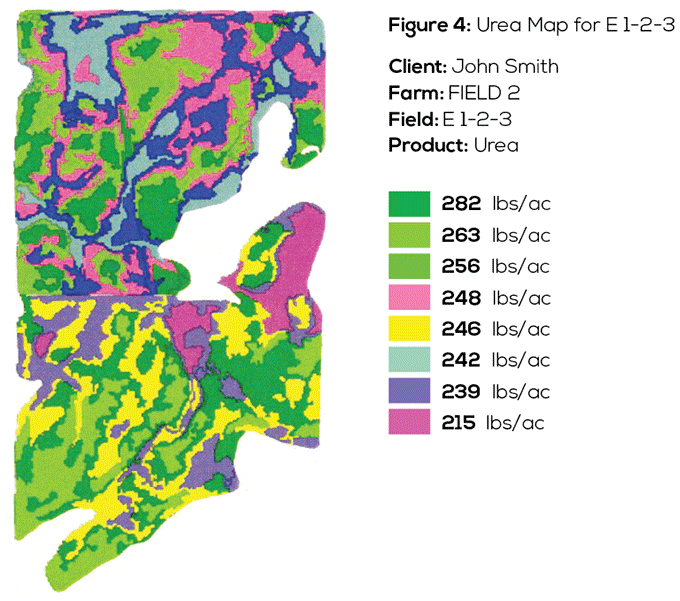
After your samples have been tested, your agronomist will sit down with you to review your results. Together you will set yield targets by zone, based on your experience with the land and compiled data from both the map and the zone test. In this example there are 10 different management zones to go through on this piece of land (5 zones in each map). Upon completion, we will have your total amount of fertilizer per field as well as overall yield expectation to help your budgeting process. See Figure 4 for an example of a urea map based on soil test result and yield goals for E 1-2-3.

Field Ready
Prior to seeding you will have your prescription maps loaded in your monitor as well as paper copies in hand. Your 360° Ag Consultant, along with your local equipment dealer, will help troubleshoot your equipment and ensure you are ready to go!

